
You open your best-seller list before placing a supplier order. A product you've sold for years has more sales than one you added recently, but you can't tell which product sells faster.
Sales velocity tells you which product sells faster. In ecommerce, sales velocity is units sold ÷ months in stock: the number of units a product sells per month while customers can buy it. You can use that number to compare older and newer products, then decide what to reorder or discount. WooCommerce doesn't calculate it for you, but you can work it out from your orders and product list.
Why total sales can give you the wrong impression
A product can appear near the top of your best-seller list because you've sold it for a long time. A product you've listed for three years has had three years to collect sales. One you added last quarter has had only three months. Even if the newer product sells twice as fast, it can still appear below the older one.
A product can also appear lower on the list because it ran out of stock. If it was unavailable for four months, customers couldn't buy it during those months. The product's total sales don't tell you how well it sold when you had stock.
Compare these two products:
- Product A launched two years ago and has sold 240 units, or 10 a month.
- Product B launched six months ago and has sold 90 units, or 15 a month.
Product A comes first when you sort by total sales, with 240 units against 90. But Product B sells faster: 15 units a month, while Product A sells 10.
Sales velocity accounts for how long each product has been available to buy, so you can compare a product you added last quarter with one you've sold for three years.
How to calculate sales velocity
Start with this formula:
Sales velocity = units sold ÷ months the product has been listed
For a useful result, you need to account for when you added the product and when you couldn't sell it.
Count from the product's start date
A product you added in October has been listed for three months by January. Divide its sales by three. If you divide by twelve, the result makes the product look as though it sells four times slower than it does.
Subtract the time it was out of stock
Say a product sold 120 units over the last twelve months, but you had no stock for four of those months.
- Divide 120 by all twelve months, and you get 10 units a month.
- Divide 120 by the eight months you had stock, and you get 15 units a month.
Use 15 units a month when deciding how much to reorder. Customers couldn't buy the product during the other four months, so those months shouldn't lower your estimate of how fast it sells.
The adjusted formula is:
In-stock sales velocity = units sold ÷ months in stock
From here on, “sales velocity” means this adjusted number.
How to work it out in WooCommerce
You need the units sold, the date you added each product, and an estimate of how long it was out of stock.
- Find the units sold per product. Go to WooCommerce → Analytics → Products and use the last 12 months. A shorter period can make one good weekend look like a lasting increase in sales. A longer period can leave you relying on older sales after customers have started buying less. Make sure the count leaves out canceled orders and failed payments, which never became sales, and refunded orders, which you didn't keep.
- Find how long each product has been listed. Look for its publish date on the product list in WooCommerce. Count 12 months for a product older than 12 months. For a newer product, count from its publish date.
- Estimate the time out of stock. WooCommerce doesn't record when a product went out of stock or came back, so you'll need to reconstruct those dates. For a product that normally sells every week, look at its order dates. A long gap without orders may have been a period when you had no stock. You can use that gap as an estimate, but don't treat it as a confirmed stockout. Subtract the estimated months out of stock from the months the product was listed within your date range.
- Divide units sold by months in stock. Put each product in its own spreadsheet row and calculate the result.
For fifty products, this can take an afternoon. You'll need to repeat the work every few months as sales change. With five hundred products, the calculation keeps getting postponed, and until it's done, you choose what to buy from the list sorted by total sales.
What counts as fast or slow?
Three units a month can be slow for phone cases and good for handmade furniture. A number from another store won't tell you how to judge your products.
Rank the products in your own catalog by in-stock sales velocity. Reorder the fastest sellers first and give them the most visible places on your site. At the bottom of the list, look for products you've held for a long time, because you've paid for stock that still hasn't sold.
You decide which selling speeds count as fast or slow in your store. A practical starting point is to:
- Treat the top quarter of your products as the first ones to keep in stock and promote.
- Examine products that haven't sold for months.
- Treat a year without a sale as dead stock.
Check why a product isn't selling before you discount it. A product with no sales this quarter may be out of season, newly listed, or hard to find on your site. Each of those calls for something other than a price cut. Our guide to what to do with dead stock explains how to make that check.
What to do with the number
Compare each product's sales velocity with the quantity you have left, then decide what to do.
- Fast seller, low stock: reorder it first. Divide monthly sales velocity by 30 to get units sold per day. Then divide the units you have left by that daily number to estimate how many days your stock will last. If your supplier needs more days than that to deliver, you're already late ordering. Our guide to days of inventory on hand explains the stock calculation, and our guide to the reorder point explains when to order. You can use those guides to set up a weekly check.
- Fast seller, plenty of stock: help shoppers find it. Put these products at the top of the category page and include them in your product recommendations.
- Slow seller, unsold stock: decide what to do with it. Check whether you can get the product selling again or need to clear the remaining stock. Follow the steps in our guide to what to do with dead stock above.
- New product: judge it over the time you've sold it. Measure a six-week-old product over its own six weeks. Expect its monthly sales figure to change a lot until you have a few months of sales history.
- Seasonal product: judge it by sales during its own busiest months. A Halloween product's sales in April won't tell you what to reorder for October. Our guide to seasonal inventory management explains how to plan for the months when customers buy it.
Sales velocity counts units. ABC analysis ranks products by the revenue they bring in. An expensive product can sell few units and still bring in substantial revenue, so it helps to compare both rankings. Our ABC analysis guide explains when to use each one.
How Tendlio helps you decide what to reorder or clear
Tendlio is a WooCommerce plugin that does these checks for you. Doing this by hand means collecting sales, checking product dates, estimating time out of stock, and updating a spreadsheet. You then need to compare the results with the stock you have left. Repeat that work across your catalog whenever you need updated sales figures, and it can delay decisions about what to buy or discount.
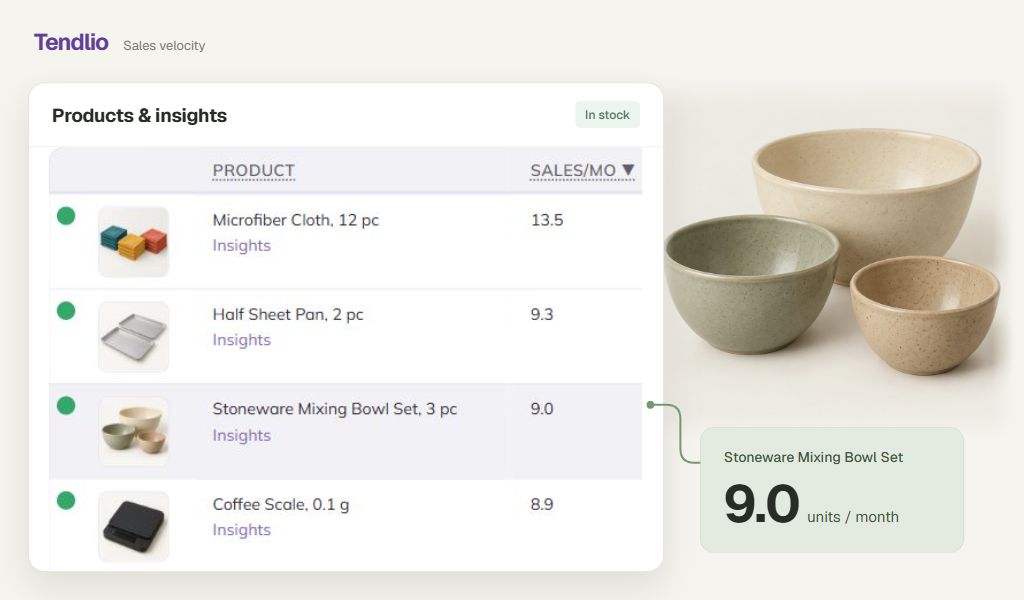
Sales velocity for every product, every week
- Every week, from your orders. Tendlio calculates each product's monthly sales figure during its weekly analysis, or whenever you start an analysis yourself. The calculation uses orders from the last 12 months and leaves out canceled, failed, and refunded orders, along with free gifts, so the comparison uses units sold and ignores product-page views.
- From the day you added the product. A product you listed eight weeks ago is measured over those eight weeks.
- Without the days it was sold out. Tendlio records when each product sells out and when it comes back in stock, from the day you install it. Every stockout it has recorded in the last 12 months is left out of the calculation, so those days don't lower the product's monthly sales figure.
Your catalog, ranked
On Products & insights, sort by Sales/mo to see which products sell fastest. The health dots compare selling speed within your own catalog, and the Fast, Slow, and Dead filters help you find products to review. Tendlio also distinguishes new products that haven't sold yet from dead stock, and marks seasonal products that are currently out of season. Those distinctions help you avoid treating every product without recent sales as something to discount.
The Stopped selling filter finds products that sold in the last year but have now gone longer than usual without a sale, so you can check the price or the photos before the product turns Dead.
In the same table, the ABC column ranks the products by revenue, so a pricey product that sells a few a month still shows up as one of your top earners.
What to do next
- Reorder from the Restock page. The Restock page shows products that are about to run out, with the days of stock left compared with the supplier's delivery time, so you can see which products need a reorder. The page also suggests roughly how many of each product to order, from its in-stock pace and its sales in the same months last year, so you don't calculate each order quantity yourself.
- Clear on the Manual outlet page. For Slow and Dead products you've decided to clear, you choose the discount and can apply it to one product or a list, so you control how much you reduce the price.
- Start with the biggest amounts. Your to-do list can also show the estimated monthly revenue you're losing from unavailable best-sellers, and the cash tied up in stock that won't sell soon, such as products that haven't sold in a year or products you hold many months of. You can then decide which products to deal with first.
Want every product ranked by its in-stock pace, with the ones about to run out and the ones tying up cash already sorted for you? Start your free trial of Tendlio.
FAQ
What is a good sales velocity?
Three units a month can be too few or a good result, depending on what you sell. Rank your own catalog by in-stock sales velocity, give the fastest sellers priority, and watch whether each product moves up or down that ranking.
What's the difference between sales velocity and sell-through rate?
Sales velocity tells you how many units a product sells per month while it's in stock. Sell-through rate tells you what share of the stock you bought sold during a particular period. Our sell-through rate guide explains the second calculation.
How often should I recalculate it?
Before every reorder, and at least once a month. Seasons, trends, and price changes affect what customers buy, so a figure you calculated six months ago may no longer tell you which products to reorder.
How do I handle seasonal products?
Judge a seasonal product by how much it sells during its own busiest months. A discount given because off-season sales are low can cut the price of stock that would have sold at full price a few months later.
Why not use conversion rate?
Conversion rate divides orders by views. Shoppers can add a product to their cart from a category page without opening its product page, so some purchases won't have a corresponding product-page view. For inventory decisions, use the units sold in orders and the time the product was in stock.